



-
Dashboard

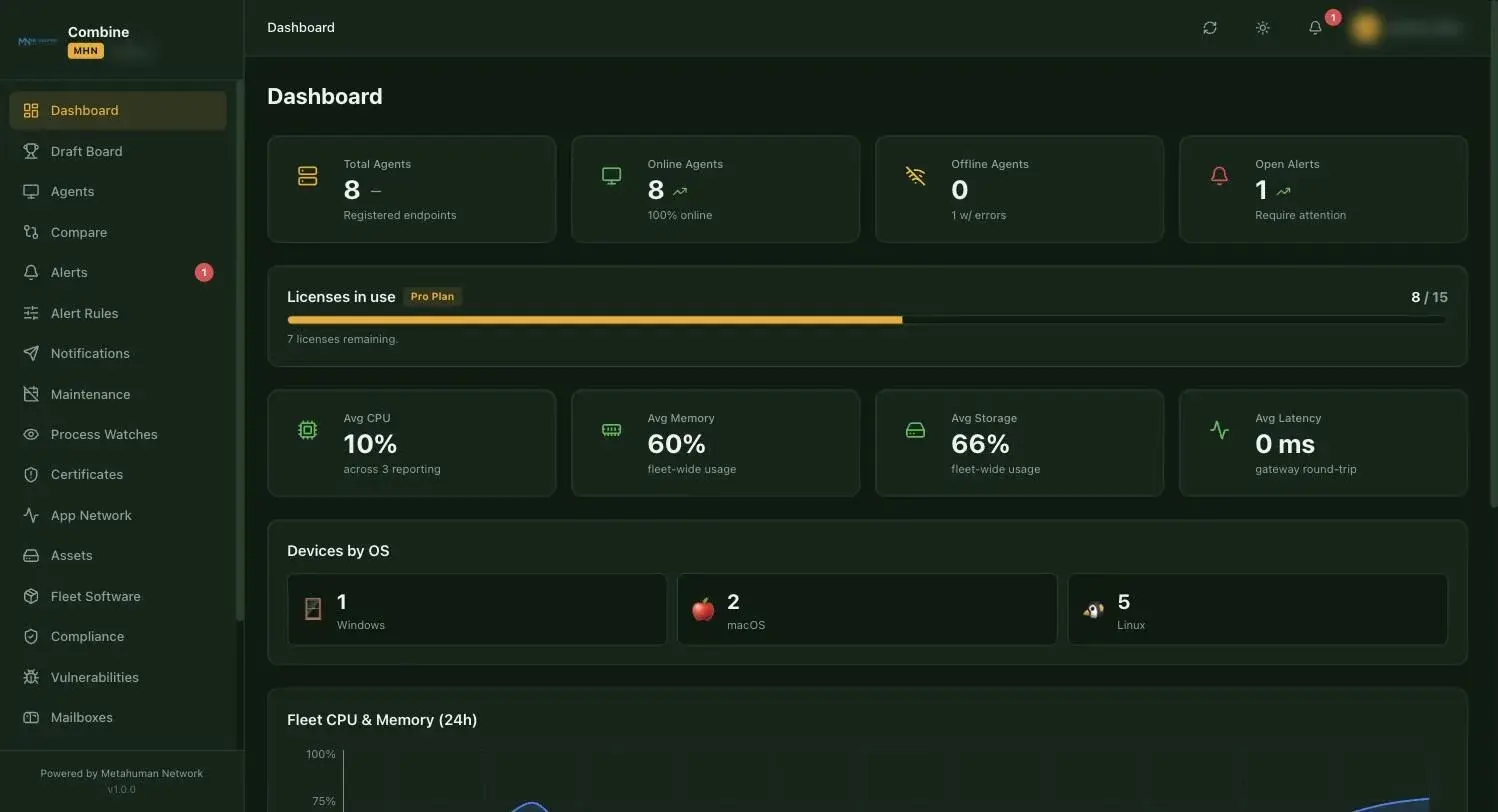
- • Fleet tiles the moment you log in: total, online, and offline agents plus open alerts
- • License usage bar — seats in use vs. your plan
- • Fleet-wide averages for CPU, memory, storage, and gateway latency
- • Devices-by-OS breakdown across Windows, macOS, and Linux
- • 24-hour fleet CPU & memory trend charts
-
Draft Board
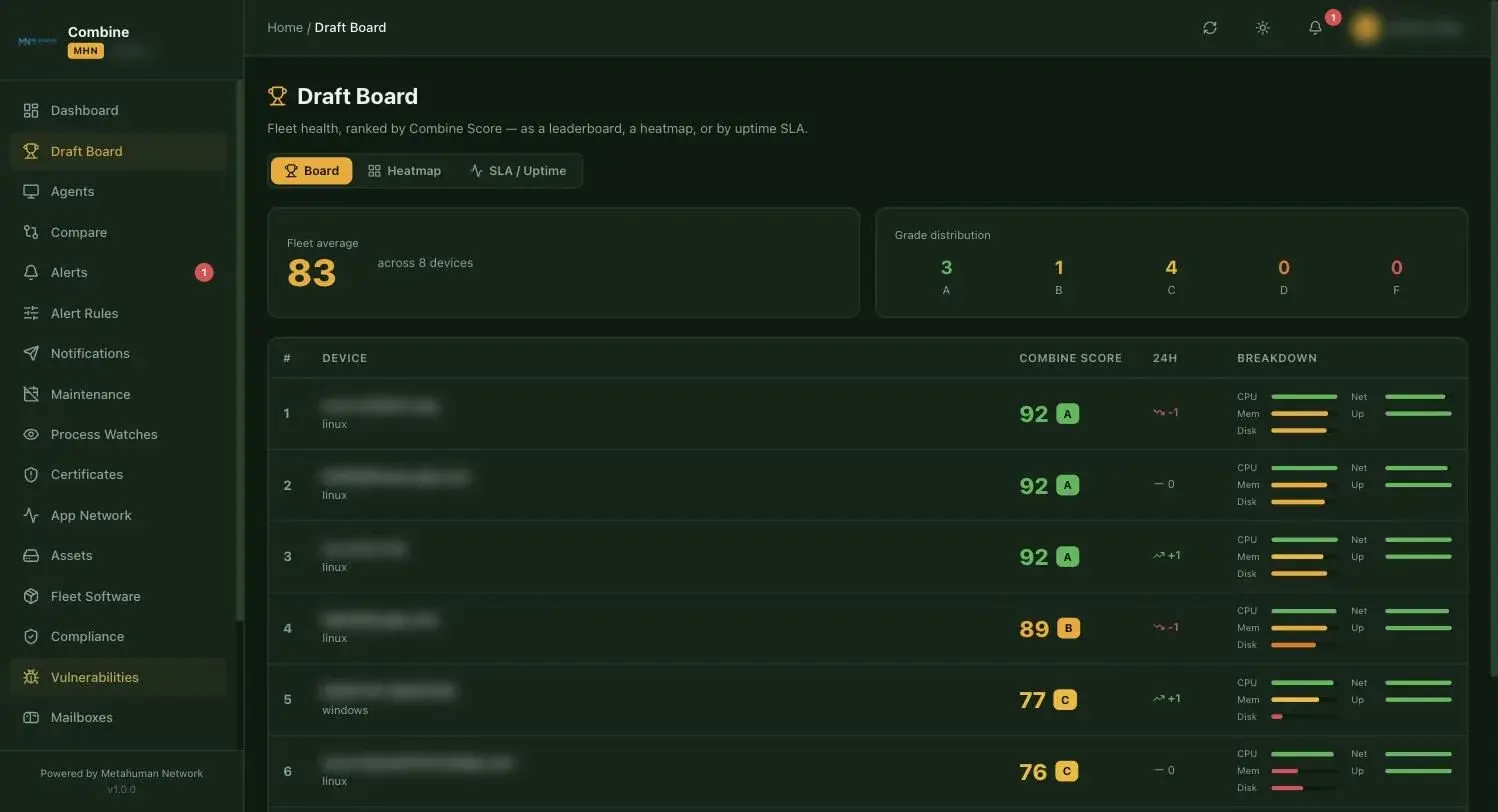
- • Combine Score: weighted 0–100 health grade per device (CPU, memory, disk, availability, network), lettered A–F
- • Leaderboard, Heatmap, and SLA/Uptime views over 24 h, 7 d, or 30 d
- • Fleet average score and grade distribution at a glance
- • Per-device breakdown bars with 24-hour trend arrows
- • Hour-granularity rollups retained for roughly 400 days
-
Agents
- • Native agents: signed & notarized .pkg (macOS), MSI (Windows), and a single ~9 MB static Go binary (Linux .deb)
- • Metrics over HTTPS about every 30 seconds, plus a live WebSocket command channel
- • Collection interval tunable from 10 to 3600 seconds per org or device — re-times live, no reinstall
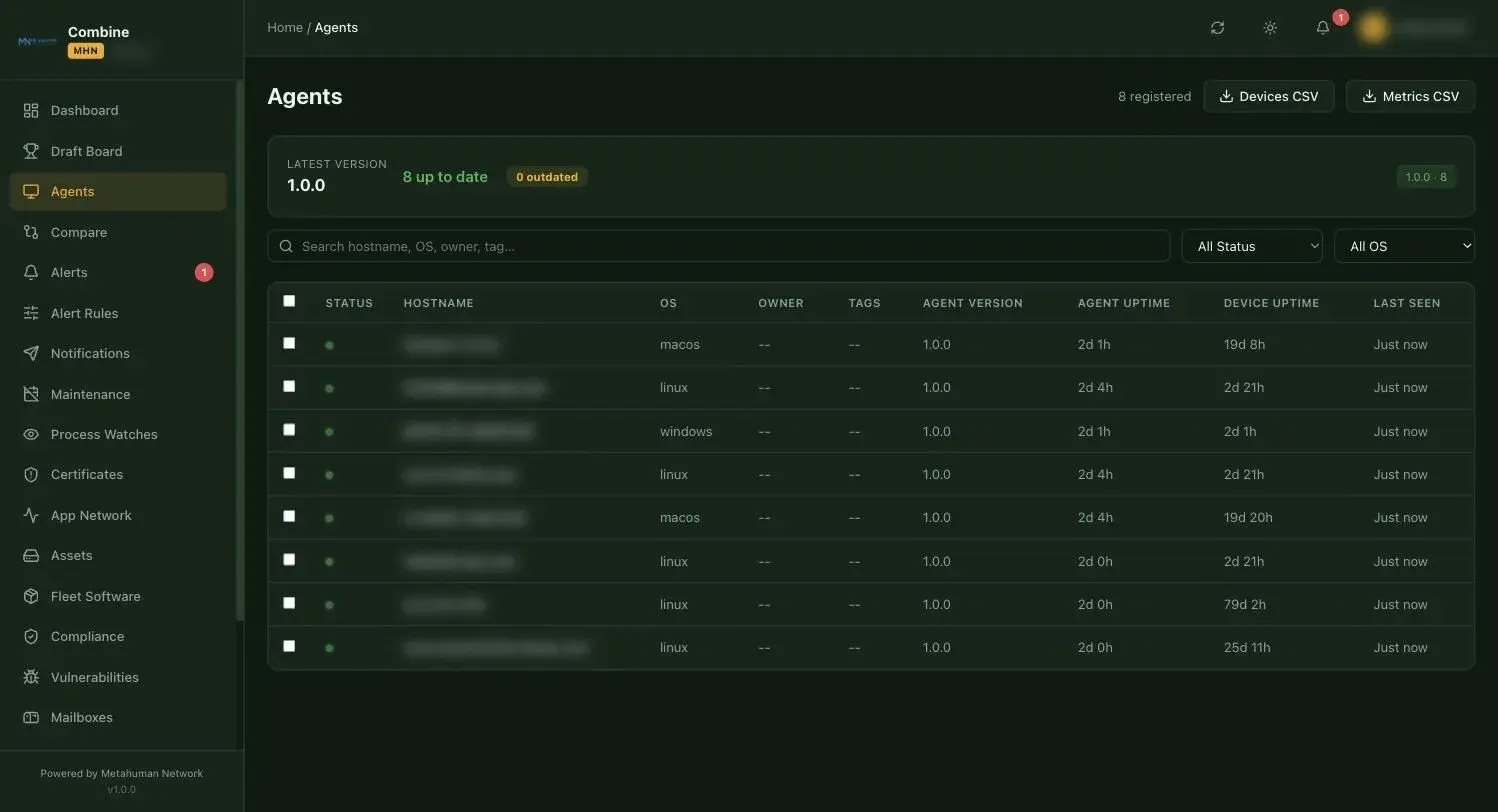
- • Agent version-drift view with up-to-date/outdated counts; devices and metrics CSV export
- • Search, filters, and saved presets; bulk tag, set-owner, restart, uninstall, or delete
- • Stable machine-id identity prevents duplicate devices
- • Per-device drill-down: processes, crashes, logs, user presence, and jetsam/OOM kills
-
Compare
- • Side-by-side comparison of two to four devices
- • Values that differ across the selected devices are highlighted automatically
-
Alerts
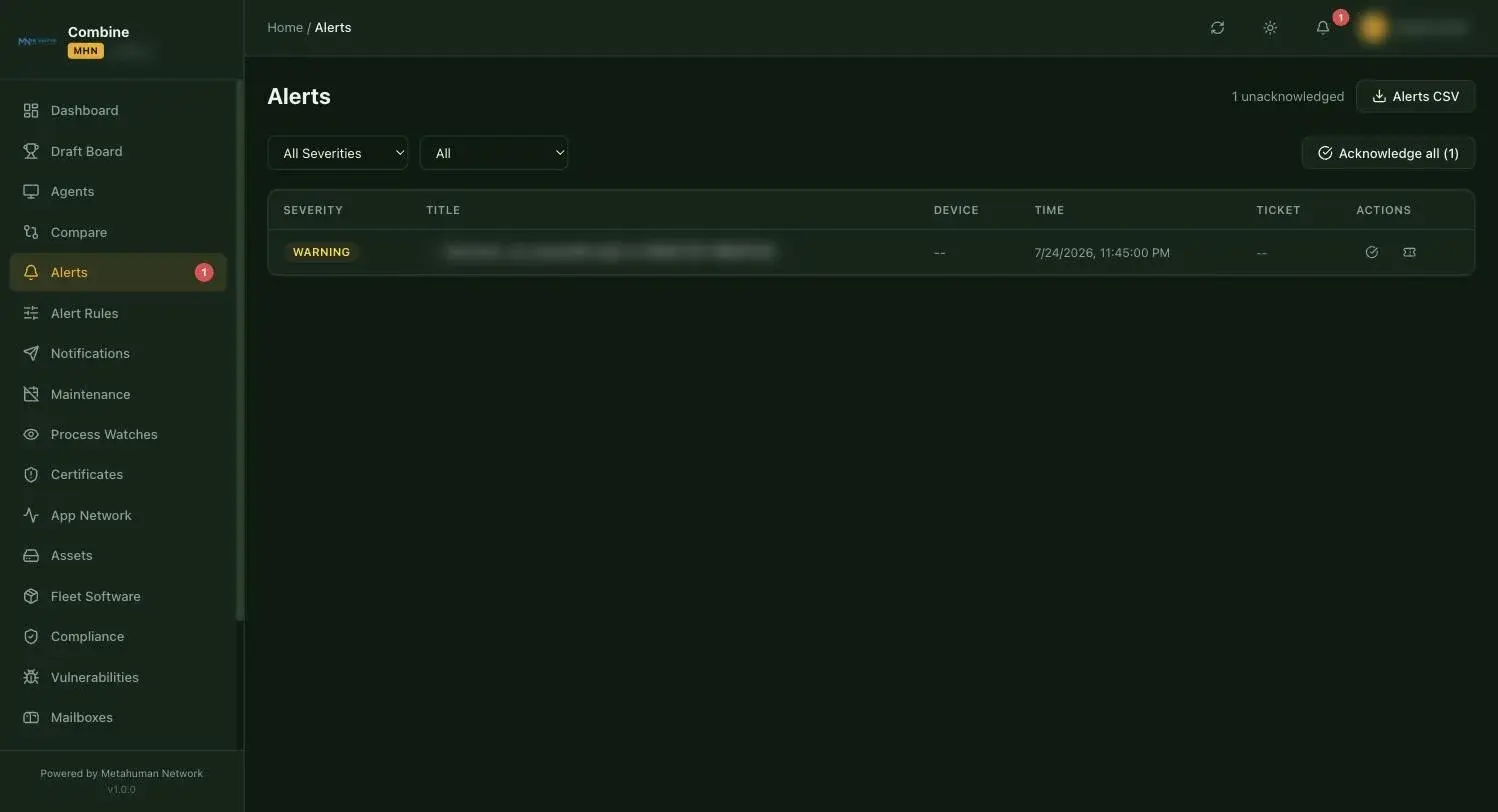
- • Critical, high, warning, and info severities with acknowledge and acknowledge-all
- • Escalating offline alerts by minutes offline — auto-clearing when the device reconnects
- • Ticketing hand-off to Metahuman Helpdesk, ServiceNow, Jira, or Zendesk
- • Full alert history with CSV export
-
Alert Rules
- • Per-metric threshold rules scoped to the whole fleet, a tag, or a single device
- • Anomaly detection (Pro): per-device CPU/memory baselines with tunable σ sensitivity and culprit-process awareness
- • Memory-leak detection (Pro) via regression on per-process memory growth
- • Flap suppression and tiered escalation policies keep alerting quiet
- • Configurable offline-alert tiers
-
Notifications
- • Email, Slack, and HMAC-signed webhook channels — with retry and auto-disable
- • Scheduled digest summaries
- • Native desktop notifications on macOS, Windows, and Linux endpoints
-
Maintenance
- • Maintenance windows silence alerts during planned work
- • Scheduled per org, alongside escalation policies and digests
-
Process Watches
- • Must-run rules alert the moment a critical process stops
- • Must-not-run rules alert when banned software appears
- • Alerts raise and clear themselves automatically
-
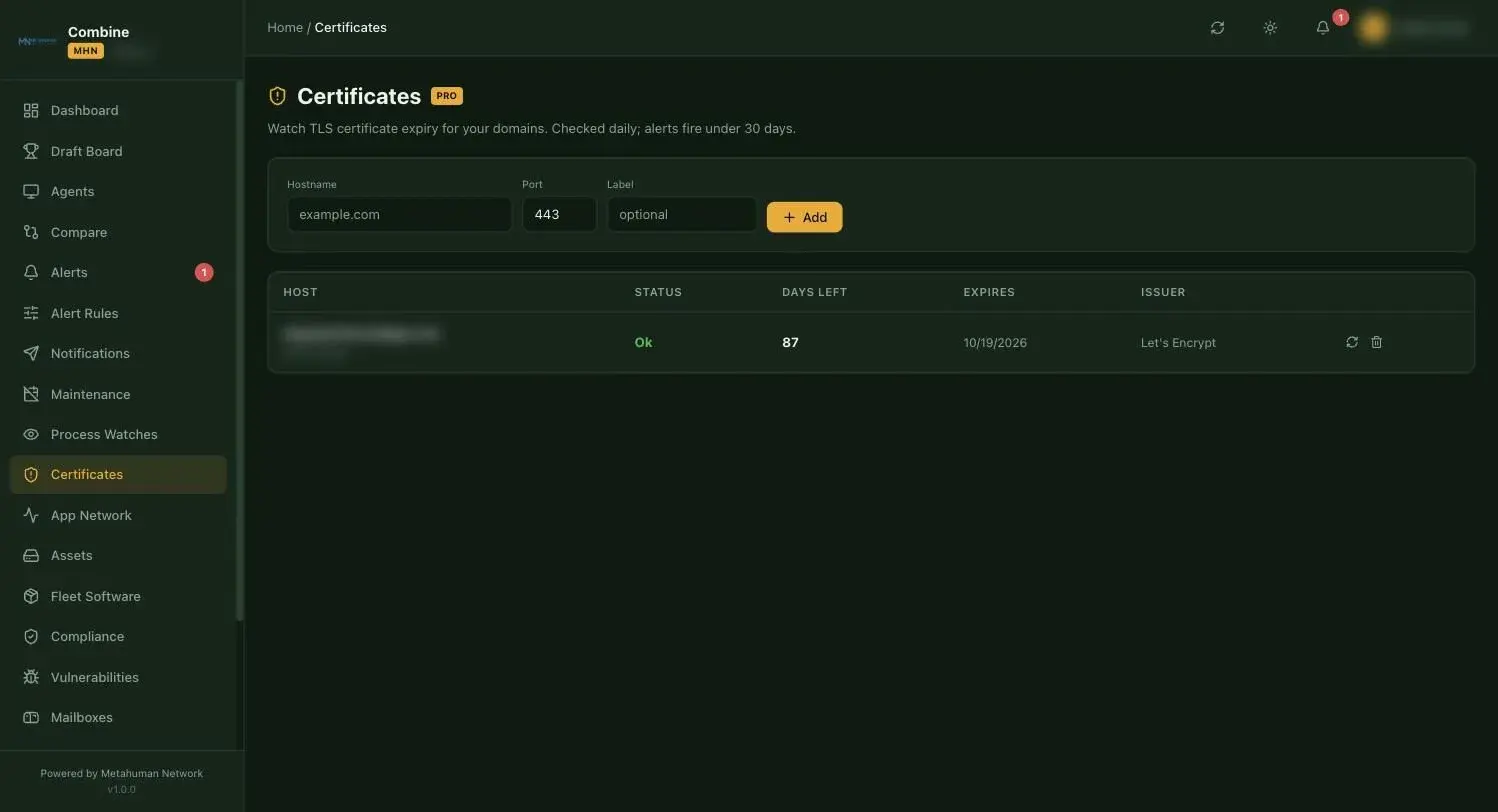
Certificates (Pro)
- • TLS certificate and domain expiry watching for any hostname — checked daily
- • Alerts fire when under 30 days remain
- • Days-left, expiry date, and issuer tracked per host with custom labels
-
App Network
- • Per-application network telemetry: bytes, latency, and connection counts
- • TCP retransmits surfaced as an early signal of connection trouble
- • Sits alongside per-process memory for full per-app context
-
Assets
- • Hardware and software inventory per device, including every fixed and attached volume
- • Warranty / AppleCare tracking (Pro) via provider lookup, estimate, or manual entry
- • IP-based geolocation to help recover lost or stolen devices
-
Fleet Software (Pro)
- • Search any installed software across the entire fleet by name
- • See exactly which devices have it and which versions they run
-
Compliance (Pro)
- • Flag any device running banned software
- • Flag devices running an app below a minimum version
- • Flag in-scope devices missing required apps — AV/EDR, backup clients, and the like
-
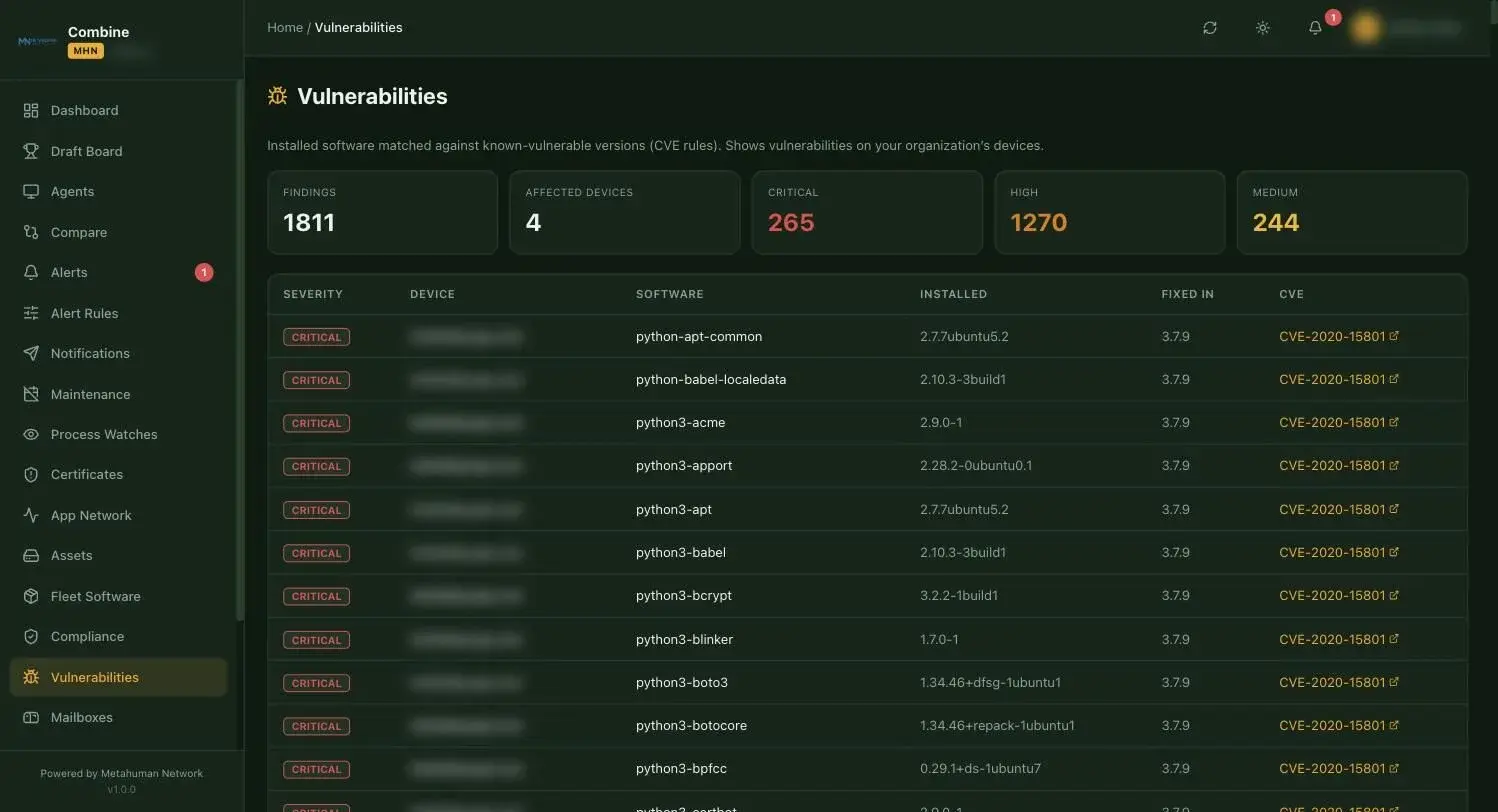
Vulnerabilities
- • Installed software matched against CVE rules into per-device, severity-ranked findings
- • NVD (NIST) auto-sync every 6 hours converts CPE version ranges into org-scoped findings
- • Summary tiles: findings, affected devices, and critical / high / medium counts
-
Mailboxes (Pro)
- • Per-org mailbox health monitoring
- • Toggle per tenant; agents pick up changes on their next cycle